Inventory Shrinkage Formula: Turning a WooCommerce Stocktake Into a Rate
Expected minus counted, priced at cost. The shrinkage formula, a worked example, both rate conventions, and how to get the two numbers out of WooCommerce.
Updated

In this article12 sections
Inventory shrinkage is expected quantity minus counted quantity, priced at cost: the unexplained part of what a stock count turns up. A count hands you a pile of variances; the formula turns that pile into one number you can actually manage — and then watch move.
This walks through the formula, where each input comes from in WooCommerce, what separates real shrinkage from ordinary data error, and why the single figure matters far less than its direction.
What shrinkage is — and what it isn’t#
Shrinkage is the gap between the stock your records claim you have and the stock that physically exists, when the records claim more.
Three things it is not, all of which get lumped in and shouldn’t be:
- Positive variance is not negative shrinkage. Finding more than expected is almost never good news — it’s usually an admin error somewhere upstream. Netting a +12 against a −12 hides two separate problems and reports zero.
- Markdowns and write-offs you recorded are not shrinkage. If you knowingly binned damaged stock and recorded it, that’s a recorded loss, not an unexplained one.
- A single bad count is not shrinkage. One product off by 90 units is a mis-scan or a case-versus-unit mistake. Investigate outliers before they enter the calculation.
Shrinkage is specifically the unexplained shortfall. Keeping that definition tight is what makes the number worth tracking.
The formula#
In units, per product:
Shrinkage (units) = Expected quantity − Counted quantity
In money, across the count:
Shrinkage value = Σ (shortfall in units × unit cost)
Then express it as a rate. There are three conventions in common use, and the only real mistake is mixing them — which is easier than it sounds, because the numerator you get out of a stock count is at cost and the benchmark you compare it to is at retail:
| Rate | Basis | Formula | Use when |
|---|---|---|---|
| Of inventory | Cost ÷ cost | Shrinkage at cost ÷ recorded inventory value at cost × 100 | You want to know how leaky your stockholding is |
| Of sales | Retail ÷ retail | Shrinkage restated at retail ÷ retail sales for the period × 100 | You want to compare against published retail benchmarks, which are stated on this basis |
| Of cost of goods sold | Cost ÷ cost | Shrinkage at cost ÷ COGS for the period × 100 | You hold cost data and would rather not restate anything at retail |
Pick one, write the basis down next to the figure, and never switch — a change of denominator can halve or double your “improvement” without anything real happening. The second and third rows come out at the same number when your margin is steady, so in practice the choice is about which figures you actually hold.
The first row is the awkward one, because it needs a stock valuation rather than a sales total, and WooCommerce stores a single cost per product rather than cost layers. If you have never had to produce that figure, what your recorded stock is actually worth at cost covers where it comes from and what it can honestly be used for.
A worked example#
A count covering 64 products comes back with a net shortfall worth €427 at cost. Retail sales for the period since the last count were €38,000, the gross margin on them was 45%, and the recorded stock at cost is €61,000.
The €427 is at cost, so it cannot be divided straight into retail sales. There are two ways to get to a rate you can compare with a published benchmark, and they are the same expression rearranged — take whichever one matches the data you hold. Restate the shrink at retail:
427 ÷ 0.55 = €776 at retail
776 ÷ 38,000 × 100 = 2.04% of sales
Or stay at cost on both sides and divide by cost of goods sold instead:
COGS ≈ 38,000 × 0.55 = €20,900
427 ÷ 20,900 × 100 = 2.04% of COGS
And the inventory basis, which needs no margin assumption at all:
427 ÷ 61,000 × 100 = 0.70% of stock at cost
Three rates, one count, all of them defensible. What trips people up is dividing €427 straight into €38,000, getting 1.12%, and then holding that up against a benchmark stated at retail — a cost numerator over a retail denominator, which sits below the benchmark by roughly the gross margin. Some retailers do track shrink at cost against sales at retail deliberately, and there is nothing wrong with it. It only misleads when it goes out unlabelled.
On its own, whichever rate you chose means very little. Next quarter’s number on the same basis is what makes it useful.
Getting the two numbers out of WooCommerce#
The formula needs an expected quantity and a counted quantity for the same moment in time. That second requirement is where most manual attempts fall apart: if you export a stock report on Monday and count on Wednesday, the difference includes two days of trading and isn’t shrinkage at all.
This is what a snapshot-based count is for. When a stocktake session starts, expected quantities are frozen. Everything you count is measured against that baseline, so sales during the count don’t contaminate the result.
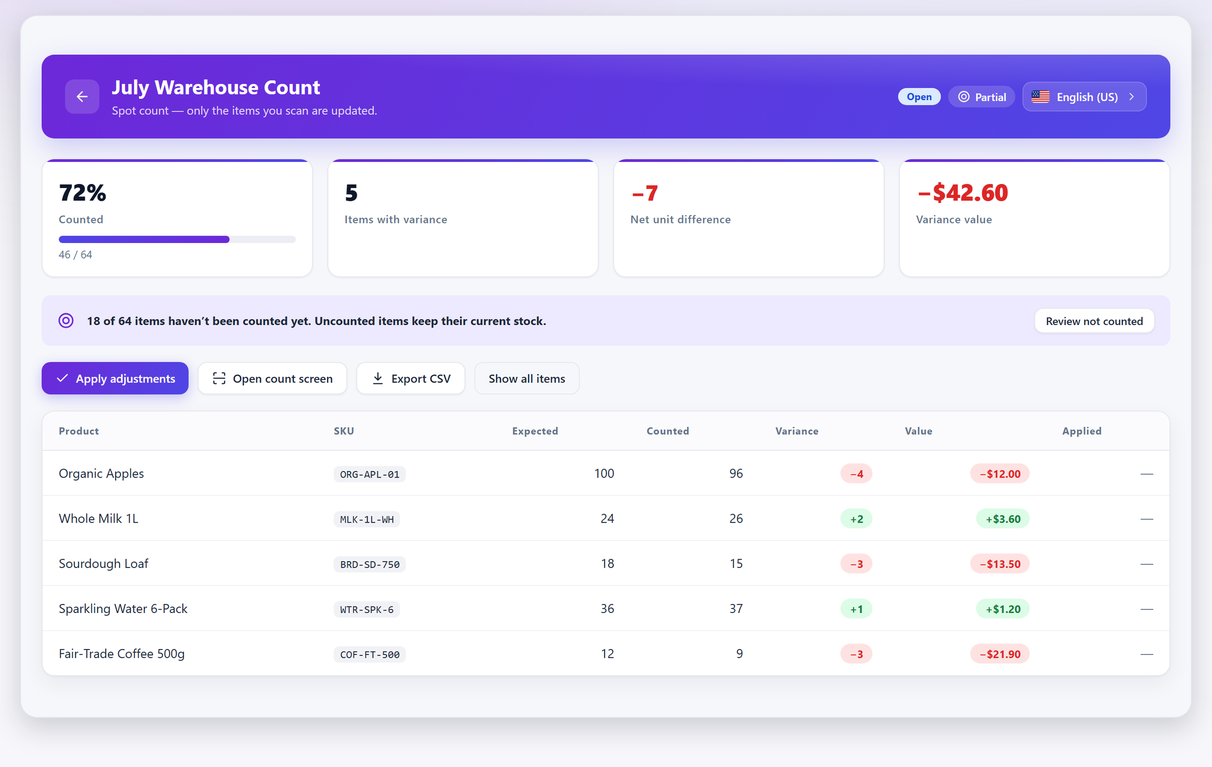
For the money column you need unit costs. Stocktake’s value reports use the product cost data available to the session, so where your products already carry a cost the shortfall is priced for you. Where they don’t, you have two options: set costs for your A items only (the ones that dominate the total anyway), or run the calculation on units and apply an average cost per category in a spreadsheet. The second is rough, but a rough shrinkage figure you track quarterly beats a precise one you never produce.
Producing the sheet without a plugin#
WooCommerce already ships an exporter, and for the expected-quantity half of the formula it is the whole answer: Products → All Products → Export, generate the CSV, download it. No SQL, no database access, and the default column set already carries SKU and stock. Add a Counted column and you have a count sheet.
What that export does not carry is unit cost, which is the one column the money side of the formula needs. If you have phpMyAdmin or equivalent, this pulls expected quantity and cost side by side:
SELECT p.ID,
       sku.meta_value   AS sku,
       p.post_title,
       stock.meta_value AS expected_qty,
       cost.meta_value  AS unit_cost
FROM   wp_posts p
LEFT JOIN wp_postmeta sku   ON sku.post_id   = p.ID AND sku.meta_key   = '_sku'
JOIN      wp_postmeta stock ON stock.post_id = p.ID AND stock.meta_key = '_stock'
LEFT JOIN wp_postmeta cost  ON cost.post_id  = p.ID AND cost.meta_key  = '_cogs_value'
WHERE  p.post_type IN ('product','product_variation')
AND    p.post_status IN ('publish','private')
ORDER BY p.post_title;
Run it in phpMyAdmin and use its Export button to get a CSV. On WP-CLI, plain wp db query prints an ASCII table to the terminal rather than writing a file, so use wp db query --skip-column-names < query.sql > stock.tsv and import that as tab-separated instead.
Four things to check before you trust what comes out:
- The table prefix.
wp_is the default; plenty of installs use something else. Change both table names if yours differs. - Keep
product_variationin the list. Where a variable product manages stock per variation, the variation rows hold_stockand the parent holds none; where it manages stock at the parent, the reverse is true. Querying both post types is what catches either arrangement. - Confirm the cost meta key. It depends on where your costs come from — WooCommerce’s own Cost of Goods Sold writes
_cogs_value, and a third-party cost plugin will use its own key. Check withSELECT DISTINCT meta_key FROM wp_postmeta WHERE post_id = 123 AND meta_key LIKE '%cost%'against a product you know has a cost set. - The export is a snapshot of the instant you ran it. This is the problem from the top of the section, reached from the other side: run it immediately before counting starts, and don’t trade against those lines in between, or the difference you compute includes sales as well as shrinkage.
That last one is the manual route’s only real weakness, and it is not fixable with a better spreadsheet. If it is the part that worries you, what the various WooCommerce stock count plugins actually do is the wider comparison, ours included.
Before you call it shrinkage: clean the data#
Run this filter over the variance report first. It usually removes a surprising share of the total.
- Pull the outliers. Anything wildly off is a counting or data event, not loss. Recount it.
- Separate positives from negatives. Report them as two figures. A count with +180 and −190 is not a €10 problem; it’s two processes that are both broken.
- Check the recently-changed products. If an item was imported, edited or synced since the last count, treat its variance as suspect.
- Look for whole-category patterns. A category uniformly short by small amounts is usually receiving, not theft — and it’s fixable.
What survives all four is your shrinkage.
Reading the rate#
Published retail benchmarks put typical shrink in the region of 1–2% of sales. Across recent cycles of the US National Retail Federation’s National Retail Security Survey — the ones covering fiscal 2021 and fiscal 2022 — the reported average has sat in the region of 1.4% to 1.6% of sales. Treat those as orientation rather than a target: they’re dominated by large US chains, and a small online-and-shop WooCommerce business has a very different risk profile from a supermarket.
And note the basis before you compare anything to them. Those figures are stated at retail — shrink restated at retail over retail sales. A rate you built from a cost numerator sits below them by roughly your gross margin, so the 1.12% from earlier would look comfortably under benchmark while the same count, converted, reports 2.04%.
What the benchmark is genuinely useful for is a sanity check on your method. If your first calculation comes out at 11%, you probably have a data problem rather than a theft problem. If it comes out at 0.02%, check whether you’re counting blind — an open count that shows the expected quantity tends to produce reassuring numbers that mean nothing.
Where shrinkage actually comes from#
The NRF’s 2023 figures attribute retail shrink roughly as: external theft including organised retail crime about 37%, employee theft about 28.5%, administrative and paperwork error about 21.3%, and vendor fraud about 5.4%. Again — US retail at scale, not a small WooCommerce store.
One piece of provenance worth knowing: in December 2023 the NRF publicly withdrew a widely-circulated claim that organised retail crime accounted for close to half of retail shrink. That was a separate figure, not the external-theft share above, but it is a reminder that the attribution of shrink is contested in a way the totals are not. Read the split as indicative rather than settled.
Even so, the third slice — administrative and paperwork error, the 21.3% — is the one worth your attention, because it’s the one you can fix from a keyboard. Administrative error covers receiving the wrong quantity, refunds that never restocked, imports that overwrote stock, and units counted as cases. For a small store running its own operation, that share is often larger than the survey suggests, simply because there are fewer people and more manual steps.
Which is good news: it means your first shrinkage number probably contains a chunk of fixable process error, not just unavoidable loss. The eight common causes of wrong stock levels is a reasonable place to start hunting.
Tracking it across counts — the number that matters#
One shrinkage figure is a data point. It cannot tell you whether things are getting better or worse, whether the change you made worked, or whether a particular category is bleeding.
So keep a simple table, one row per count:
| Date | Scope | Lines counted | Accuracy | Net variance (cost) | Rate | Basis |
|---|---|---|---|---|---|---|
| 31 Mar | A items | 64 | 92% | −€427 | 2.04% | retail / sales |
| 30 Jun | A items | 64 | 96% | −€180 | 0.86% | retail / sales |
Same scope, same method, same denominator, quarter after quarter. The last column is there so that in a year’s time you can still tell whether two rows were ever comparable — it costs nothing to fill in and it is the first thing you will wish you had. Two rows already tell you something no single count can. Export the count sheet each time so you can rebuild the numbers later if you need to.
If you’re counting a slice of the catalogue at a time rather than everything at once, a cycle-counting rota gives you these rows automatically — one per session.
Keeping that table by hand works, and it is worth doing. Stocktake Pro keeps it for you instead — an accuracy and shrinkage trend built from the counts you have already applied, so the row above appears without you typing it.
Reducing it#
In rough order of effort-to-benefit for a small store:
- Fix receiving. Count deliveries in against the packing note, on arrival, every time. This is the highest-yield habit in the list and it costs minutes.
- Fix the refund path. Decide what happens to a returned item and who marks it restocked. Refunds that don’t restock, and restocks of items that went in the bin, are both pure invented variance.
- Stop overwriting stock with imports. Remove the stock column from any CSV you didn’t intend to change.
- Count more often, in smaller slices. Frequency beats thoroughness — an error found in three weeks is traceable, the same error found in eleven months is not.
- Count blind. Everything above depends on measurement, and an open count doesn’t measure anything.
Notice that four of the five are process changes, not purchases. Shrinkage in a small store is usually an operations problem wearing a security-problem costume.
Where this stops, and your bookkeeper starts#
Worth being plain about the boundary, because it is the next question. Applying a count in WooCommerce corrects the stock quantity and nothing else. It does not write a journal entry, post anything to your accounts, or produce a loss adjustment your bookkeeper can file. Stocktake exports the count and the variance at cost as CSV so you can hand that to whoever does your books, and that is where its job stops.
None of the above is bookkeeping advice, either. How a shrinkage write-off is recorded — which account it lands in, when, and what evidence has to sit behind it — depends on your jurisdiction and on your accountant. The figure is yours to produce; the entry is theirs.
Shrinkage FAQ#
What is the formula for inventory shrinkage?
In units it is expected quantity minus counted quantity, per product. In money it is the sum of each shortfall multiplied by its unit cost. As a rate it is that value divided by one of three denominators, times 100: recorded inventory value at cost, retail sales for the period (with the shrink restated at retail first), or cost of goods sold for the period. Pick one, write down which, and stay with it.
What is a normal shrinkage rate?
Published retail benchmarks put typical shrink in the region of 1 to 2% of sales, and across the National Retail Security Survey cycles covering fiscal 2021 and fiscal 2022 the US National Retail Federation’s reported average sat in the region of 1.4% to 1.6%. Those figures are stated at retail and dominated by large US chains, so convert your own rate to the same basis before comparing, and treat them as orientation rather than a target for a small store.
Do I need cost data to calculate shrinkage?
To express it in money, yes — a unit cost per product, whether that comes from WooCommerce’s own Cost of Goods Sold fields or from a cost plugin you already run. You can start without it by tracking the shortfall in units, or by setting costs only for your highest-value products, which dominate the total anyway.
Is a positive variance the same as negative shrinkage?
No. Finding more than expected is usually an administrative error upstream, not a gain. Netting a plus twelve against a minus twelve reports zero and hides two separate problems — report positive and negative variance as two figures.
How often should I calculate shrinkage?
Every time you count, using the same scope and method. A single figure tells you almost nothing; the comparison between consecutive counts is what shows whether a process change worked.
What is the biggest fixable cause of shrinkage for a small store?
Administrative error — receiving the wrong quantity, refunds that never restocked, imports that overwrote stock, units counted as cases. It is a smaller slice of published retail figures than theft, but for a small operation with manual steps it is often larger, and it is the slice you can fix without buying anything.