Cycle Counting in WooCommerce: How Often, How Many, Which Items First
How often to count each class, how many lines fit one session, and which products come first — a cycle count rota for a small WooCommerce shop.
Updated

In this article11 sections
Most small stores plan to count everything once a year, and most small stores don’t. The annual count needs a closed shop, a free weekend and a level of collective willpower that January rarely supplies, so it slips to February, then to “after the sale”, then to never.
Cycle counting is the alternative: instead of counting everything once, you count a slice of the catalogue on a rotation, all year, without closing. It’s less heroic and considerably more effective, and it fits a WooCommerce store better than an annual count ever did.
The rhythm that works for most small shops is high-value or fast-moving lines monthly, mid-value lines quarterly, and the long tail twice a year. On an 800-SKU catalogue that adds up to about 77 lines a week, well under an hour with a scanner. Step 1 settles which lines go first, and Step 3 works the session size out for your own catalogue — because the size of the session is what decides whether the rota survives. This is how to build one you’ll actually keep.
Cycle counting vs the annual count#
| Annual physical count | Cycle counting | |
|---|---|---|
| Coverage | Everything, once | A slice at a time, continuously |
| Disruption | Shop closed, whole team | An hour, one person |
| Error age | Up to 12 months old when found | Days or weeks old |
| Fails when | You postpone it | You skip a week — and just resume |
The last two rows are the argument. An annual count is all-or-nothing — miss it and you have no measurement at all, whereas a cycle count that slips a week is a cycle count that slips a week. And if a receiving process has been quietly wrong since March, an annual count tells you in January, ten months of bad decisions later; a monthly rotation tells you in April, while you can still remember what changed.
Why the annual count keeps not happening#
It’s worth naming this honestly, because the fix is structural rather than motivational. An annual count is a large, indivisible, high-stakes task with a scary irreversible action at the end of it. Every one of those properties makes it easy to postpone.
Cycle counting inverts all four: small, divisible, low-stakes, and — if your tool takes a restore point before applying — reversible. That’s why people keep doing it.
Step 1: Classify your catalogue#
Not every product deserves the same attention. The standard approach is ABC classification, which is just Pareto applied to inventory: a small share of your products accounts for most of your value.
- A items — the lines that make up the first 80% of your annual value. High-value or fast-moving, often both.
- B items — the next slice, from 80% up to 95%. Steady, moderate value.
- C items — the last 5%, the long tail. Lots of SKUs, little money.
Cut by cumulative value, and only by cumulative value. On most catalogues the A list then turns out to be somewhere near the top fifth of your SKUs — that is the shape to expect, not a second way of drawing the line. If your own numbers put it at a tenth or at a third instead, believe your numbers and keep the value cuts.
Getting this out of WooCommerce: go to Analytics → Products, set the date range to the last twelve months, and sort by Net sales. The Download button at the top right of the table gives you the CSV. In a spreadsheet, add a running cumulative total of net sales and a column for that total as a percentage of the grand total. Everything up to 80% is your A list; 80–95% is B; the rest is C.
If you have Cost of Goods data set, sort by value rather than revenue for a truer picture — a low-margin bestseller ties up less money than its sales figure suggests. One caveat before you trust that order: the field holds a single cost figure per product or variation, and a cost typed in once when the product was created and never revisited will quietly distort the ranking. Read down the top thirty and check they still look like what you pay today.
Step 2: Set a frequency per class#
A workable starting point for a small store:
| Class | Count every | Why |
|---|---|---|
| A | Month (or fortnight) | Errors here cost the most and appear the fastest |
| B | Quarter | Enough to catch drift before it compounds |
| C | Twice a year | Cheap to be slightly wrong about |
Adjust from evidence, not instinct. After two or three rounds you’ll see which class actually drifts — if your C items come back clean every time, count them less; if a particular category is always short, count it more and go and find out why.
Step 3: Build a rota you can finish in one shift#
This is where cycle counting usually dies. A “weekly count” of 300 SKUs isn’t weekly, it’s abandoned.
Work backwards from time. Counting a shelf of familiar products with a scanner runs somewhere around 100–200 items an hour once you’re moving; that’s a rough planning figure, so measure your own on the first pass. Pick a session size that fits comfortably inside the slot you’re willing to give it — for most small stores, 30–60 SKUs.
Then divide each class across the rota:
- Week 1: A items, group 1 · Week 2: A items, group 2 · Week 3: A items, group 3 · Week 4: a B group
- Rotate B groups through the fourth week so each is covered quarterly.
- C gets no slot at all in a four-week cycle like that one — which is the hole the sizing sum below has to close.
Two practical rules that keep it alive: same day, same time, so it becomes a habit rather than a decision; and scope by physical location, not by category. Your catalogue is organised by product type; your shop is organised by shelf. Counting a category means walking the whole floor. Counting an aisle means standing still.
Stocktake itself scopes a session to the whole shop or to a set of categories — there is no aisle in the scope picker. In a partial count that gap matters less than it looks: partial mode writes only the lines you actually scan, so the scope shortens the list on screen rather than protecting the stock you aren’t counting. Counting one aisle inside a widely scoped partial session is perfectly safe. If you’d rather the list on screen matched the walk, mirror your aisles as a product category or a tag and scope to that — most worth the effort where the aisle holds a rail of sizes and colours, because that is where a line goes missing without anyone noticing.
How many lines a session, worked out#
Time gives you the size of one session. The other half of the sum is demand: how many line-counts a year the frequencies you just chose actually ask for. Multiply the lines in each class by how often you said you’d count it, add the three together, and divide by the number of sessions you will really run — call it 48 weeks, not 52.
For an 800-SKU catalogue that splits 160 A, 240 B, 400 C, on the Step 2 frequencies:
| Class | Lines | Counted | Line-counts a year |
|---|---|---|---|
| A | 160 | Monthly (×12) | 1,920 |
| B | 240 | Quarterly (×4) | 960 |
| C | 400 | Twice a year (×2) | 800 |
| Total | 800 | 3,680 |
3,680 line-counts over 48 weekly sessions is 77 lines a week — twenty-three minutes at 200 lines an hour, forty-six at 100. That sits above the 30–60 band recommended at the top of this step, and the honest consequence is that one of the two numbers has to move. Either defend a longer slot, or thin the frequencies: drop B to twice a year and C to once, and the sum becomes (160 × 12) + (240 × 2) + (400 × 1) = 2,800, which is 58 lines a week.
It runs backwards just as usefully. Session size × sessions a year is what you can afford: 45 lines a week over 48 weeks is 2,160 line-counts, and if that is below what your frequencies demand, the frequencies are fiction. Better to know in week one than to discover it in March.
The sum also settles what the rota above skates over. Three A weeks and a B week fill all four slots, so there are no quiet weeks left to drop C into. Take the 2,800 version and the weeks divide like this: the three A weeks carry 1,920 line-counts between them over the year, about 53 lines each, and the fourth week carries everything else — 480 B plus 400 C, which is 880 across the twelve fourth weeks of the year, or roughly 73 a session. Five of those twelve go to C, the other seven to B, and you give the fourth week nearer forty-five minutes than half an hour. If you would rather keep B quarterly, widen the cycle instead: three A weeks, a B week and a standing C week, with each A group coming round every five weeks rather than every four.
One caution on the 100–200 an hour: it is this article’s planning assumption, not a measurement of your shop. Time your first session, divide lines by minutes, and put your own figure in. If you come out at 130 an hour, 77 lines is thirty-five minutes and every number above moves with it.
Step 4: The same loop, every time#
Each session is the same four steps — the standard stocktake loop, just smaller:
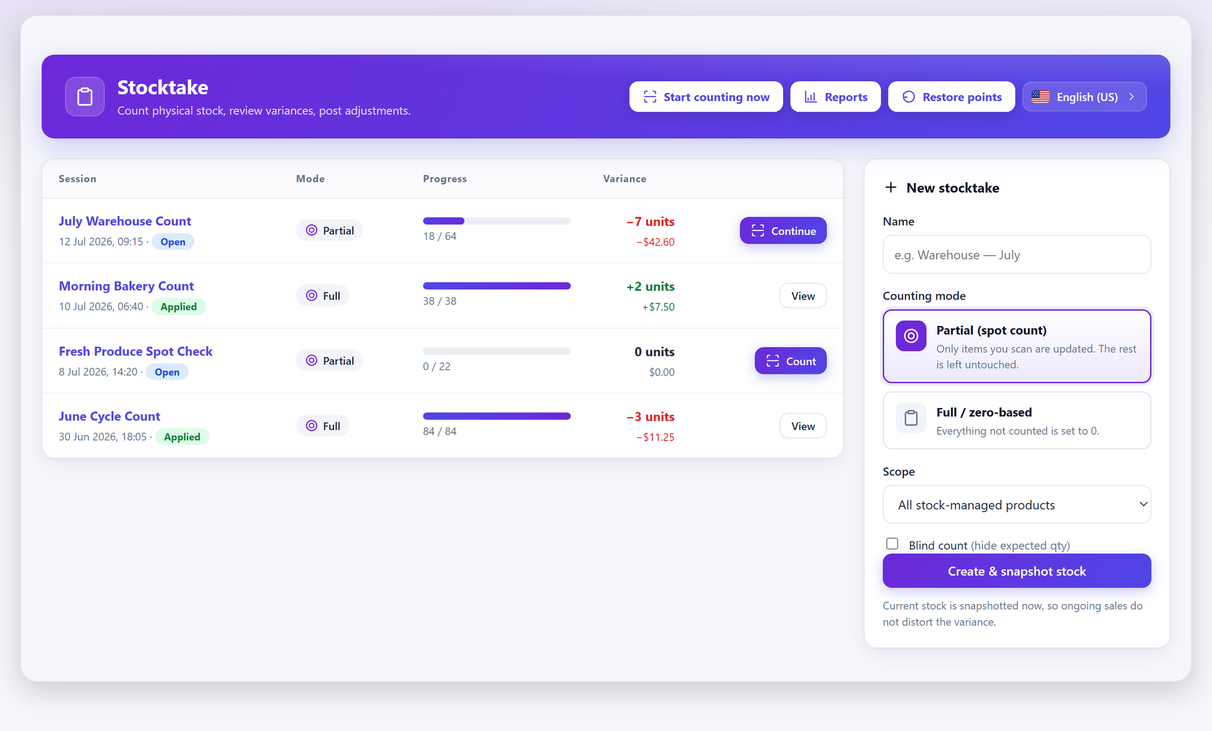
One setting matters more than all the others here: use partial (spot) count mode. A partial count only updates the items you actually scan and leaves everything else untouched. A full or zero-based count sets everything you didn’t count to zero — correct for an annual count of a closed shop, catastrophic for a Tuesday-morning count of one aisle.
Beyond that: scope the session to the categories that cover the shelf you’re standing at, turn on blind count if anyone but you is counting, review the variance before applying, and export the sheet. A cycle count happens while the shop is trading, so an order landing mid-count is the next thing to get straight — worth reading before your first session rather than after it.
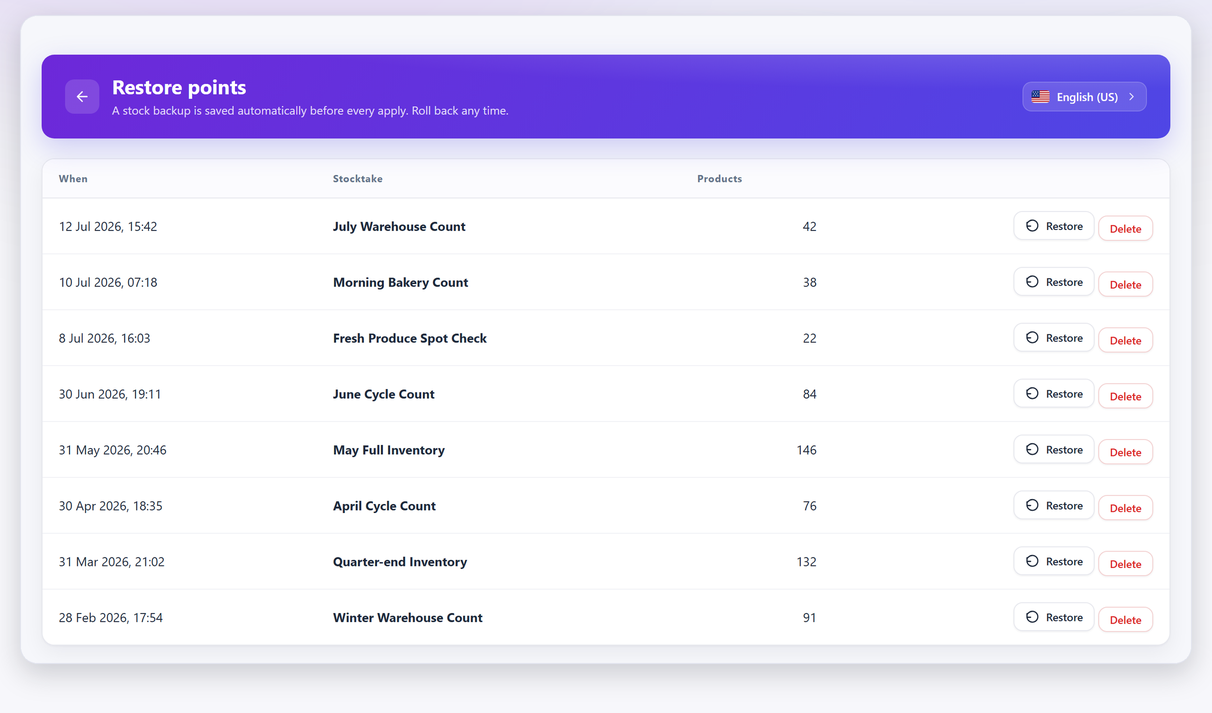
A rota only survives if each session is quick to set up. The free version of Stocktake for WooCommerce handles the session rather than the schedule: partial scoping, blind mode, the variance review, and a restore point taken automatically before anything is applied. The ABC classification stays in your spreadsheet either way — nothing stores a class against a product. What Pro adds for a rota specifically is scheduled count reminders on the cadence you set in Step 2 — weekly, monthly, quarter-end — so the slot stops depending on someone remembering it. Pro is $79 a year for one site, with a 14-day money-back guarantee.
What to measure over time#
A single session tells you about one aisle. The sequence tells you about your shop.
Three numbers are worth writing down after each count, and each one is a calculation rather than an impression:
- Count accuracy — lines with zero variance ÷ lines counted × 100. Forty-nine clean lines out of fifty-two is 94%. This is your headline health metric.
- Net variance value — the money figure Stocktake reports for the session, which it prices at cost when cost of goods data is set; with no cost set there is nothing useful to report, which is a second reason to fill cost in, at least for the A list. Watch the trend rather than the individual figure — a repeat negative variance is a shrinkage rate, not bad luck.
- The dominant class — which class, and which category inside it, the variance came from. This is what turns counting into diagnosis.
Accuracy by line and accuracy by value tell different stories, which is why the class belongs in the log at all. Ninety-five per cent accuracy with every failure sitting on A items is a worse week than ninety per cent spread across the long tail: the first is money walking out, the second is the long tail behaving like the long tail.
Six columns, one row per session, anywhere you’ll actually keep it:
| Date | Scope | Lines counted | Zero-variance lines | Net variance value | Dominant class |
|---|---|---|---|---|---|
| 4 Mar | Aisle 3, A group 1 | 52 | 49 | -$128.40 | A |
| 25 Mar | Aisle 2, C block | 61 | 58 | -$9.10 | C |
A shop that counts and never compares is just doing data entry. The comparison across sessions is the entire return on the exercise: it’s how you find out whether the receiving change you made in March actually worked.
Do you still need an annual count?#
For the shop floor, no: a well-run rotation covers everything at least once a year, catches errors far sooner, and leaves an audit trail per session. For the accounts it is a separate question that your accountant decides, not you — the year-end count your accountant signs off is a different exercise, with requirements that vary by country and by auditor, and that post goes into them.
Getting started this week#
Don’t build the whole programme first. Do this:
- Export Analytics → Products for the last year and mark the lines making up the first 80% of cumulative value — or your top twenty by value if you want to start smaller. That’s your A list.
- Split it into four groups by shelf location.
- Put a 30-minute slot in the calendar, same day each week.
- Count group 1 as a partial, blind session. Note the accuracy and the variance value.
Four weeks later you’ll have counted your most valuable stock, you’ll know your real counting speed, and you’ll have a baseline to improve against — which is considerably more than most stores get from an annual count they never run.
Cycle counting FAQ#
What is cycle counting?
Counting a portion of your inventory on a repeating rotation rather than counting everything at once. Over a full cycle every product gets counted, but no single session requires closing the shop or a whole team.
How often should I cycle count?
A reasonable starting point for a small store is high-value or fast-moving items monthly, mid-value items quarterly, and the long tail twice a year. Adjust from what your first few counts show rather than from instinct — count the classes that actually drift more often.
How do I work out which products are my A items?
Go to Analytics → Products, set the range to the last twelve months and sort by net sales, then export. Add a cumulative total column: everything up to roughly 80% of the grand total is your A list. If you have cost data, sorting by value rather than revenue gives a truer picture.
Which counting mode should I use for a cycle count?
Partial, or spot, count mode — it updates only the items you actually scan and leaves the rest untouched. Never use full or zero-based mode for a partial rotation, because it sets everything you did not count to zero.
How many products should one session cover?
Whatever fits the time slot you are willing to defend every week — for most small shops, 30 to 60 lines. Then check that against the demand side: add up lines × frequency for each class and divide by the sessions you will actually run. An 800-SKU catalogue counted monthly, quarterly and twice-yearly needs 3,680 line-counts a year, or 77 a week over 48 weeks, so either the slot or the frequencies have to give. Measure your own counting speed on the first session and size the rota from that rather than from a number in an article.